A little over a week ago, I ran some hard intervals at the track with my muscle oxygen sensor. I really should have been watching my muscle oxygen values a bit more closely as they would have made the workout a lot more effective. Here are my lessons learned– and how you can use the same strategy in your workouts.
This post supplements my earlier post, An Idiot’s Guide to Using a Muscle Oxygen Sensor by giving more details of how to use a Moxy or BSX Insight device to optimize recovery during intervals. If you’re entirely new to muscle oxygenation, it might be worth reading my other post first.
The Workout
The workout that I ran was a set of “broken” mile repeats. I always use a muscle oxygen sensor on these workouts– in this case, I was using my BSX Insight. These are 2 x 800 meters with a tiny 15-second “micro-recovery” between them. The break is really mental as there isn’t even time to get a sip of water before turning around, walking back to the start line, and hitting the next interval. This follows the short recovery strategy that I have blogged about before. After each mile, I took a much longer four-minute recovery.
My first interval wasn’t so fast– about a 6:37 pace– as I wasn’t warmed up that well. My next two intervals were right around the pace that I was hoping to run. They came in at about 6:15 and 6:17 respectively. I was pretty tired going into the fourth interval but could only muster a 6:26.
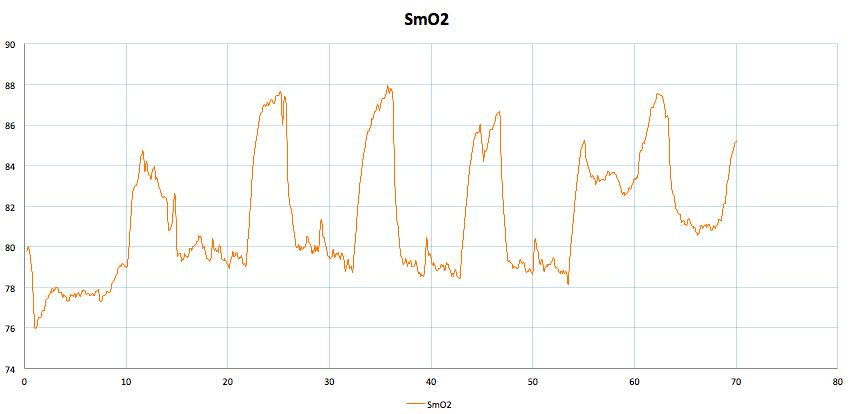 While it was a good workout, it could have been a GREAT workout if I had just paid closer attention to my realtime SmO2 values during the workout. The graph above shows my SmO2 values during the workout and clearly predicted everything that would happen– and my SmO2 values were warning me how I could have improved things. Just to make sure the graph makes sense, I should point out that time (expressed in minutes) run along the bottom of the chart. Each of the “troughs” around 18 minutes, 30 minutes, 40 minutes and 50 minutes represent my SmO2 values during each of the mile repeats. Each of the spiky “peaks” between them represent my recovery values between each interval.
So how do my SmO2 data predict where improvements could be made?
First, I had a pretty slow first interval when I didn’t have to be that way. A lot of us just have mediocre results during the first interval in a workout and just chalk it up to not being fully warmed up. Here is graphic proof because my muscle oxygen values barely broke 84 while I was up near 88 between intervals. I really should have run some harder short intervals during my warmup!
Second, and much more importantly, my SmO2 values were telling me to take more/better recovery before the (slower) last interval– if I had paid attention, I could have squeezed a bit more speed out of that last interval. Notice those lofty SmO2 values before my second and third intervals when I was running nice and fast? Notice that SOMETHING caused a divot during my recovery and my SmO2 values barely broke 86 right before my last interval. I seem to recall jogging to retrieve an errant soccer ball for some kid— just enough to interrupt my recovery. And sure enough, it definitely took a toll on my last interval as I was almost 10 seconds slower.
Practical Advice: It’s About Trends Not Numbers
Using a muscle oxygen sensor is TOTALLY different from using other devices like a power meter. With a power meter, you can set specific zones or training goals based on very specific numbers. For instance, I may want to hold 235 watts for 20 minutes. With a muscle oxygen sensor, it’s much harder to do that. For instance, my SmO2 values generally reach into the upper 80’s during a running workout– but some days, it can be quite a bit higher or lower.
For tracking interval recovery in particular, the goal should be looking for trends and not specific goal numbers. For instance, after I finishing a hard interval, my SmO2 will climb rapidly. I’m not looking for it to reach a specific value– instead, I will be curious how high it can go during my recovery. So say I ran I am supposed to run 4 x 1 mile on 2 minutes recovery. I will want to know what the maximum SmO2 value reached during that first recovery break. Let’s say it’s 86. Then I run my second interval and watch my SmO2 during that second interval. Let’s say it hits 85. As these are pretty short recoveries, that may be expected. One percentage point is no big deal. So I run my third interval and this time my muscle oxygen hits only 82. Wow, a three percentage point drop is pretty significant– probably I need more recovery because my fourth interval is going to be pretty terrible. I would wait until it hits 84 (continuing the 1 percentage point drop trend) and then start my next interval.
In the case of my workout, my SmO2 values were only going up– not down– during my recoveries. This is because I was giving my body a pretty long recovery between each effort– four full minutes. This is because these intervals were supposed to run nearly all-out. Because of the long recovery between each interval, I would not want to see an SmO2 drop of more than a point– preferably less than half a point.
Thus, using SmO2 for structuring your recoveries really depends on your workout– and the goals of your workout. If you are doing Tabata intervals, for instance, the whole goal is to cause your muscle oxygen to crash. So with HIIT or Tabata intervals, I wouldn’t bother using a muscle oxygen sensor for timing recoveries. This isn’t to say that muscle oxygen isn’t good data to have during Tabata or HIIT intervals– it is great for helping analyze workouts once you’re done. But if you are doing longer intervals with longer recoveries, having a muscle oxygen sensor can really help you squeeze the most value out of that workout.
Until you really get the hang of it, I’d recommend using a muscle oxygen sensor for any interval workout where your recovery intervals are one-minute or longer. In that case, just watch what happens during your recovery with a focus on remembering the highest SmO2 value that you hit during that first recovery. Then, do the same thing on the second interval– focus on how high SmO2 goes during recovery. Soon you’ll have a good mental image of what the numeric trend tends to be– and what the next value should be during your next recovery. All is well and good until you get an SmO2 value that significantly breaks the trend. If the trend had been upward and suddenly plateaus, don’t worry about it– your body may just be fully warmed up and so now a new trend is starting (one with consistent values). If the trend was stable or slightly declining, alarm bells should go off when you have a value that is lower than the predicted value.
It Doesn’t Tell You When to Start– It Tells You When NOT to Start
I haven’t tried basing a workout entirely on SmO2 values. Personally, I think that may backfire because SmO2 recovers so quickly during interval work– and other systems in the body likely need more time. Remember, muscle oxygen is just one factor– there are a host of other things going on in the body. But if muscle oxygen values aren’t up to par when you hit the next interval, that one factor is likely going to be a big limiter on your performance.
Instead of relying on muscle oxygen to tell me when to start the next interval, I use it as a fail-safe strategy in case my body needs more recovery. I go into an interval workout trying to stick to the timed recoveries that I have in my training schedule. Hopefully my SmO2 values will cooperate and I can stick to those times. But, sometimes nature or Fate throws a monkey wrench into the plan (like kids and their soccer balls). Thankfully, SmO2 trends are one tool that can give you a warning that gremlins have been at work and that you need a touch more recovery.
Heart Rate Doesn’t Cut It
You might be asking, “wouldn’t heart rate tell me the same thing?” Sadly, no.
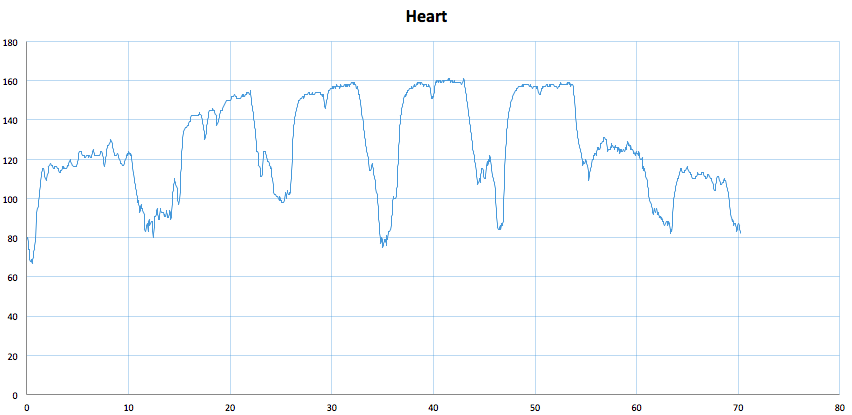 Here is the same workout, now showing my heart rate. Yes, you can see where my heart rate went down between each interval. And yes, you can even see where I chased the kid’s soccer ball. But this data isn’t anything that I could have used during my workout. My heart rate before my fourth interval was very close to my heart rate before my third interval– and both were far lower than my heart rate before my second interval when I started running much faster.
This isn’t to say that heart rate is a useless indicator. Ideally, I would have been watching heart rate as well. Heart rate tends to lag, although you can see tiny little variations in my heart rate during my 15-second micro-recoveries that show up in a much more obscure way in my SmO2 data. But the overall lag of heart rate is pretty clear from comparing these two graphs. If heart rate were as responsive as SmO2, the troughs in my heart rate graph would have been as wide as the peaks in the SmO2 data. Instead, they are much narrower, indicating that my heart rate really stayed high for at least a minute after each interval. During that same time, SmO2 was rebounding sharply. And, in the case of track intervals, it’s that quicker responsiveness that makes SmO2 data much more useful.
Pesky Details: How I Do It
As I described in the Idiot’s Guide, I use a BSX Insight muscle oxygen sensor. I then pair my BSX Insight with my iPhone and carry it with me during my track workouts in an Amphipod running belt or a SPIBelt. Once my BSX is paired with my phone, I pair it with my Garmin 920xt using BSX’s free Garmin app. This handy device lets you display SmO2 and tHb data on your watch but, until Garmin changes their system later this year, not record your SmO2 or tHb data. The app only lets you display the data on your watch– the data is recorded on the pod. (supposedly, you leave the phone behind at this point– but I never fully trust recording just to the pod so I carry my iPhone just to be safe). Once I’m done with this somewhat kludgy setup, I just watch my SmO2 values on my watch and use that to help inform my workouts in real time. All of this is promised to become much simpler once Garmin opens their apps to recording data. In the meantime, here is one of their recent blog posts that outlines all of the different options.
Thanks for reading and be sure to like the Athletic Time Machine Facebook page and follow us on Twitter @AthTimeMachine. If you found this post useful, please reblog it on WordPress, share it on Facebook, or retweet it on Twitter to share it with your friends.
