I have been playing with multiple power meters on my bike recently so that I can use a different power meter with my new disk wheels. This has been a project since well before the ITU World Championship in early October. The results of this comparison will be the subject of a future post. Today’s post is about something much geekier– how to actually compare power meter data.
 You might ask, “Why would anyone care?” First, power is incredibly important. I’ve blogged before about how power on the bike is probably the single most important metric for your training and racing. Unfortunately, as I’ve found, power isn’t a purely objective measure in cycling– it varies based on the type of power meter and its location on your bike (hub versus crank versus pedals). Thus, your FTP on one system, for instance, is going to be different from your FTP on another. Comparing power meters simultaneously is the only way to objectively make that translation. Also, you need to know the new system’s shortcomings and whether it’s really giving you useful data. I’m finding, for instance, that one of the power meters (I’m testing three) is out of sync with the other two– thus I need to get it fixed or rely on a different power meter. I wouldn’t have been to pinpoint what’s going on without comparing power meter data.
 An even bigger reason why I thought this post was important was simply because no one talks about the details about how to do the actual comparison. There aren’t any ready-made tools I know of that let you directly map power files on top of each other. Instead, it involves a combination of tools– in this case, Golden Cheetah and Microsoft Excel– to make it possible. I couldn’t find a description or video of how to actually put the pieces together.
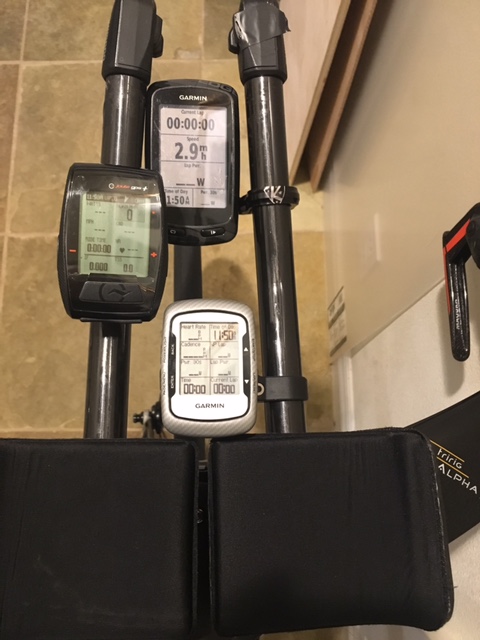
To fill this obvious void in the Internet, I created a short video describing the process. It walks through how to take your workout files, import them into Golden Cheetah, and get nice clean data over to Excel where it can be quickly graphed to create charts like the one immediately above. The YouTube video only takes a little over 10 minutes and that is the actual time it took me to get a fast comparison of three power meter files. Apologies in advance as I noted that I’m comparing three different power meter hubs, when I’m actually comparing data from three power meter systems:
- Powertap G3 hub
- Powertap P1 pedals
- Power2Max Type S crank
I noted that I’ve been working with power meter files for months now so I’ve streamlined the process quite a bit. First, I tend to use .FIT files, but you can use whatever type of file you want. Golden Cheetah does a great job of gobbling up different data types. I use .FIT files simply because that’s what I can download off of Training Peaks really easily once my workouts are uploaded. Second, I now avoid importing .CSV (comma-separated values) files into Excel because it was getting messy. .CSV files are the lingua franca of data– anything can export to them and read from them. Unfortunately, they can be a bit messy. For instance, I was getting lots of header data. Plus, each time I hit the lap button, it introduced weird data midway through my data files. Plus, the data files generally had some weird values scattered throughout them that forced me to carefully parse the files. By contrast, using Golden Cheetah gives me only nice clean data– and it only takes a third of the time that .CSV imports used to take.
If you have any other thoughts on how to compare power meter data quickly and easily, please share them! In the meantime, this is the fastest way I know how to do it.
Thanks for reading and be sure to like the Athletic Time Machine Facebook page and follow us on Twitter @AthTimeMachine. If you found this post useful, please reblog it on WordPress, share it on Facebook, or retweet it on Twitter to share it with your friends.
