For the last few weeks, I have been utterly geeking out on using my BSX Insight Generation 2 muscle oxygen sensor. If you’ve been following the buzz about muscle oxygenation, you’ll notice people talking about how this device will revolutionize sports training because it delivers what heart rate monitoring never could– an objective view into our bodies to see how we are responding to exercise stress. But it’s awfully complicated getting simple answers. This post pulls together a bunch of hours of crawling different websites and watching countless videos on muscle oxygenation.
 The Problem

If using a power meter to guide your training is cutting edge technology, then this is bleeding edge technology. It’s so new that no one has really clear answers. Well, that may be a bit overstated. There are some brilliant minds with a fairly clear vision, but they tend to be extremely detailed and more than willing to point out all the nuances, footnotes, and curves in the road than in helping novices to me to basic knowledge. If you have ever visited the Moxy Developer Forum, you’ll know exactly what I mean. Or just take a look at the comment section to DC Rainmaker’s excellent review of the BSX Insight Generation 2 monitor and you’ll notice how fast the discussion goes from simple green pastures to a convoluted path deep in a dark forest.
In a way, this is all great news for the future of this technology. Lots of bright minds obsessing about this technology is a sure sign that we will get some great answers down the road. But that isn’t very comforting to newbies to this technology. So with that in mind, I felt the need to oversimplify how to use this technology.
Isn’t Power and Heart Rate Good Enough?
But first things first. Why would you possibly want or need to know your muscle oxygen level? Isn’t a power meter and heart rate good enough? The short answer is “no.”
- Limitations of Power. For cyclists, power is the best metric of athletic performance. And, now with cool technologies like the Stryd running power meter, power is a metric available to runner’s too. In a nutshell, power is an absolutely terrific metric— and now that power is available in running, it would seem that there wouldn’t be any need for muscle oxygen, right? Wrong. The problem with power is that it measures what your body puts out– not what is going on inside your body. For instance, your watts could be trashed by a lousy night of sleep, bad nutrition, or a host of other factors that compromise your body’s performance. This is where muscle oxygenation offers additional insight into your training because it gives you a peek into what’s going on inside your body.
- Limitations of Heart Rate. But, as every endurance athlete knows, there is another metric that also gives an insight into what is going on inside your body– heart rate. Over the last forty years, just about every endurance athlete has used a heart rate monitor at one time or other. But there are number of shortcoming with using heart rate. For instance, it tends to lag quite a bit behind physical effort. It also is affected by a lot of external factors, such as heat and exercise duration. Plus, there are plenty of substances, such as caffeine, that can dramatically change heart rate. None of these shortcoming affect muscle oxygenation.
Muscle oxygenation has a lot going for it but it isn’t perfect. So far, it seems to offer a lot more insight than heart rate or power alone. But the goal isn’t to find the perfect indicator of human performance. Instead, it’s to find the best combination of indicators– and how to combine them– to give better insight into human performance.
Why I Like the BSX Insight– and a Request to the Guys at Moxy
So why do I like the BSX? After all, there are two muscle oxygenation sensors currently on the market. The Moxy Monitor was the first to market and probably has a sizable market lead. It transmits SMO2 as well as ThB. It’s a chunky little device that can be positioned anywhere on the body. A relative latecomer to muscle oxygenation is the BSX Insight monitor. This unit started as a device for estimating your lactate threshold (basically, when muscle oxygen starts to tank, you’ve just passed lactate threshold). The new Version 2 of the BSX Insight Monitor adds the ability to record and transmit realtime SMO2. At present, it doesn’t transmit ThB but this is in the works.
While the first generation of the BSX Insight was quite limited, the second generation works quite well as an all-round muscle oxygen sensor. I won’t bore you with a review of the new device as there are already two great reviews out there from DC Rainmaker and Slowtwitch.com, In a nutshell, the new version works really well.
While most researchers still prefer the Moxy, I’m staying with the BSX for the time being. The simple reason has to do with form factor and convenience. The BSX device is simple and idiot-proof– just slide it into it’s special calf sleeve, pair it with your phone, and off you go. It’s thin and doesn’t slide around in its sleeve. Because the Moxy can be placed anywhere, it has no special sleeve. Instead, you should ideally use a special rubberized light shield and an elastic band to secure it. In DC Rainmaker’s review of the Moxy, they also had him using adhesive patches to secure the Moxy to his skin– both under the sensor and over the light shield. That is WAY too difficult and cumbersome for an average consumer to use on a daily basis in training. If Moxy could reduce the form factor to something about the size of the BSX and offer a pair of compression shorts to replicate the BSX calf sleeve, I would be 100% in– and I bet their market share would swell in response. Why shorts instead of a calf sleeve? Because the best place for runners and cyclists to measure muscle oxygenation is over the vastus lateralis (outer thigh muscle). Admittedly, this is a limitation of the BSX device, which they have no intention of addressing– they have already devoted thousands of hours to perfecting their calf-located algorithms and moving a sensor to the thigh would be going back to square one. Nevertheless, don’t let this dissuade you– the calf is a perfectly fine place to put a sensor. Andrew Coggan, the great exercise physiologist and power meter genius, did some informal testing with using a Moxy in different body locations. Looking at his graphs, I think it’s pretty clear that the vastus lateralis responded most dramatically in a cycling test– but the calf muscle wasn’t too far behind. But the key point is that BSX’s calf sleeve shows how easy it is to have a really functional, light blocking garment that works great with muscle oxygenation sensors– there isn’t any reason why BSX can’t sell the same thing to its customers.
In terms of price, the BSX Insight is quite a bit less expensive. It costs about $420 for the multisport version while the Moxy costs about $720. But in looking at the two devices, the Moxy looks more like a precise lab instrument and the BSX looks like a consumer device. That isn’t meant to be a slight on the fine BSX device as their consumer device also looks a lot more streamlined and practical for daily use by consumers like me.
Summary of What Muscle Oxygenation Promises to Do– And How to Do it Yourself
If you read through even a fraction of the blog articles and videos on the net, you’ll find that muscle oxygenation promises a bunch of different uses– that all sound really amazing for endurance athletes. Specifically, the big ones are:
- Rapid Identification of Limiters to Performance. If you want to get better, the best strategy is to focus on your weakest link. This is huge for endurance athletes as we probably spend hours and hours honing our strongest links (i.e. endurance)– and making very few gains or getting injured because it’s the weak links that fall apart at race time (e.g. strength or speed).
- Effective Warm-Ups. We all go through a ritual of warming up before races and speedwork. But when we hit the hard work, we sometimes fall apart because we don’t feel warmed up enough. A muscle oxygen monitor completely prevents that.
- Setting Workout Zones. How hard should you be working out on your hard days and your easy days? Muscle oxygenation gives you insights into this.
- Optimizing Workout Intensity and Duration. Sometimes we do a set of intervals and we’re clearly not ready for it. Muscle oxygenation tells you what you can realistically handle. It also tells you when to stop because you’re just digging yourself into a hole.
- Optimizing Recovery During Interval Training. We go to the track and follow certain prescribed recovery times. But let’s face it– they are a one-size-fits-all guess. Some intervals will take more recovery and some less. Muscle oxygenation tells you if you are really ready to hit the next one– and gives you solid data to back it up.
- Nailing Down Your Lactate Threshold. Depending on whom you ask, lactate threshold is a pretty important training metric as it correlates fairly well with a person’s one-hour race pace. If you use a BSX Insight muscle oxygen sensor, figuring out your lactate threshold is pretty simple. But even if you use a Moxy, it seems reasonably easy to spot on your muscle oxygenation curves.
Pretty impressive, huh? Perfecting any one of the items above is worth a fortune any endurance athlete. At the risk of presenting an oversimplified version of how to do each of these things with a muscle oxygenation sensor, I’m going to tackle each one with some practical advice.
But first a big disclaimer: I’m still a beginner when it comes to this stuff and I’ve only scratched the surface. Instead, this is based almost entirely on what I’ve read and heard from other sources– I’ve only had a chance to really test a few of these ideas. Also, this isn’t intended as real training advice as much as training ideas– see if it actually works for you before committing to it in your workouts.
Rapid Identification of Limiters to Performance
Wow, this one took a long time to really get good answers on. At least a dozen people must have asked about how to identify limiters on the Moxy forums to no avail. Then I discovered a webinar about hockey (of all things) that made the discussion of limiters much simpler. There are countless limiters to athletic performance (such as the hemoglobin dissociation curve). Some of these limiters are discussed in the Moxy blogs. But in a very simple sense, it really comes down to three (actually two– the third is a special case of the second).
- Utilization Limitation. Your body has no trouble getting blood to your muscles– it’s just that your muscles aren’t able to process it all. This is often because your muscles don’t have sufficient mitochondria.
- Supply Limitation. You’re not getting enough oxygenated blood to your working muscle. This is often an issue with the heart and lungs. Sometimes, but much more rarely for our purposes, muscle occlusion can cause it (but this is really more of a problem for strength athletes).
- Supply-Respiration Limitation. This is really a special case of the Supply Limitation that comes up when your lungs aren’t able to get enough oxygen into the body to supply the muscles.
Note that these limiters are sport and activity specific– you’ll need to assess them separately on the bike and run. To assess where your limiter lies, all you have to do is put on your muscle oxygen monitor and carefully warm-up (see below). Then do an all-out effort for between 30-90 seconds– as we’re endurance athletes, I’d opt more towards the 90 second end. Really dig deep. Then recovery and go home and download your data. It should look something like one of the following three graphs. (feel free to click on any graph for a blown-up view)
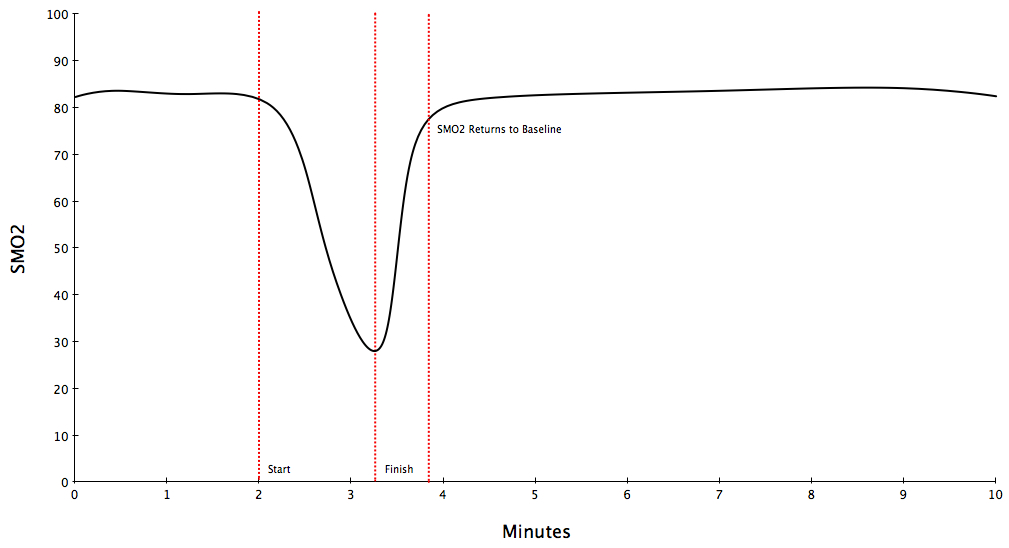
 Perfect Curve. This first graph is pretty much the ideal response. Here muscle oxygenation starts high, revealing a good warmup. As soon as the hard stuff begins, it dives down as oxygen is gobbled by the body. As soon as the exercise ends, muscle oxygen shoots upwards– in about 30 seconds, it should be back to the baseline values before you had the crazy idea of running a hard interval.
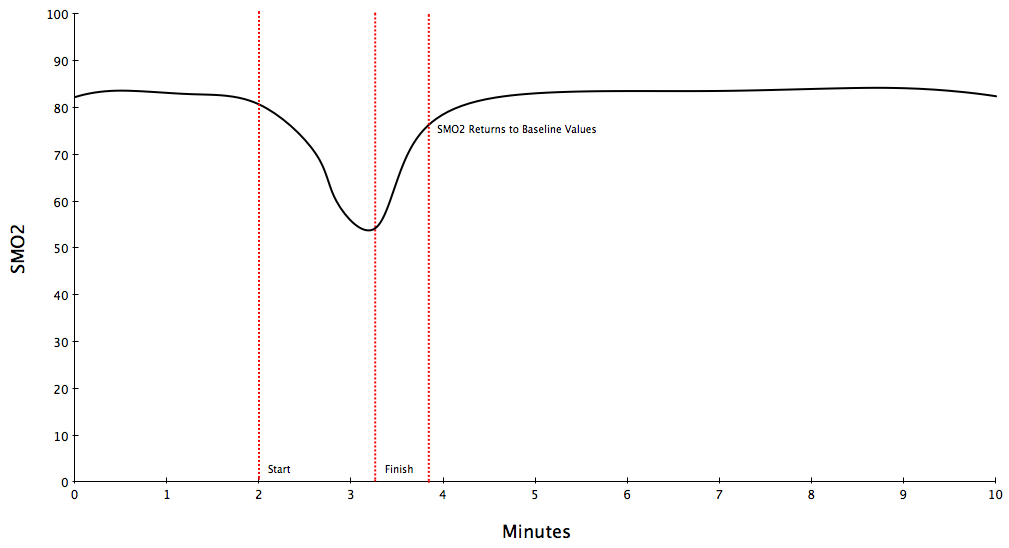
 Utilization Weakness. This second graph reveals a utilization weakness. Here the body isn’t able to process all the oxygen so muscle oxygen levels never go down as low as in the Perfect Curve. In this case, the heart and lungs are just fine and are capable of supplying more than enough oxygen to the muscles– hence the nice, high values– but there’s a lot of energy being left on the table. I suspect that this is where most well-trained endurance athletes will end up– and this time of year is a perfect time to shore up this weak spot so we can focus on more specific training as race season gets closer.
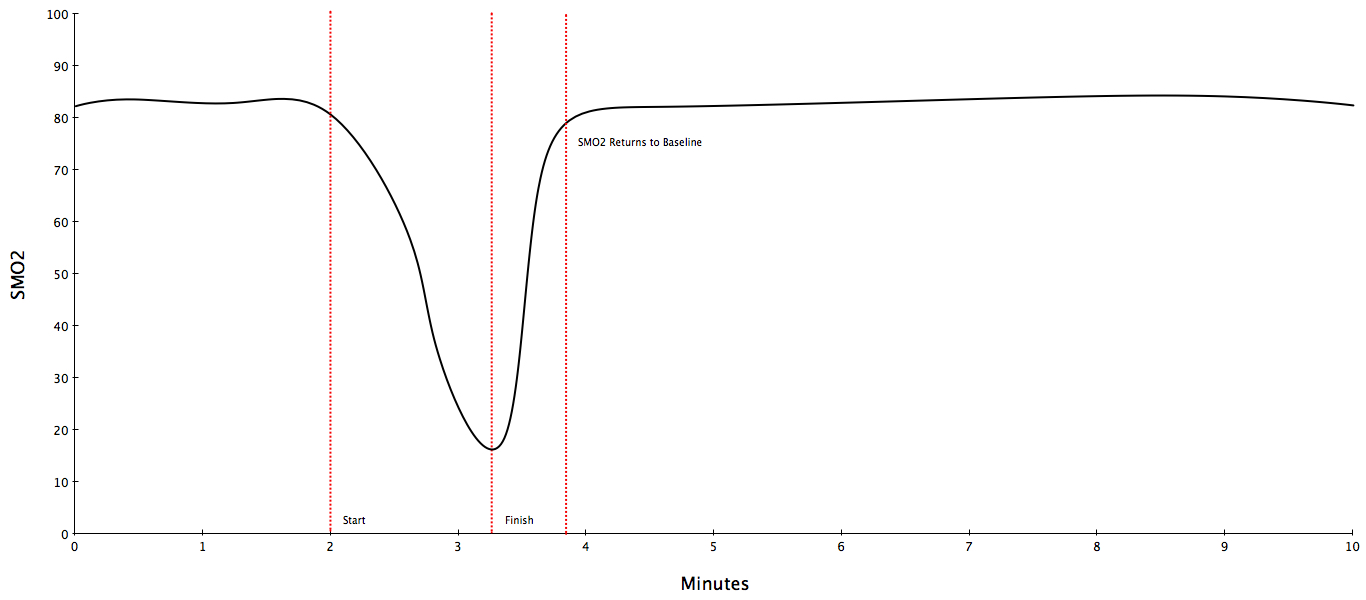
 Supply Weakness. This third graph shows the response of a very different athlete. In this case, muscle oxygen really bottoms out during the effort. This is a case where the muscles have really depleted the available oxygen and the delivery systems aren’t able to keep up. Note that this can be hard to discern compared to the Perfect Curve–how much is too low is open to debate and seems to vary between devices. As the BSX Insight devices seem to be more conservative according to users, I’d say you definitely have a supply weakness if you’re hitting below 20-25% with a BSX Insight.
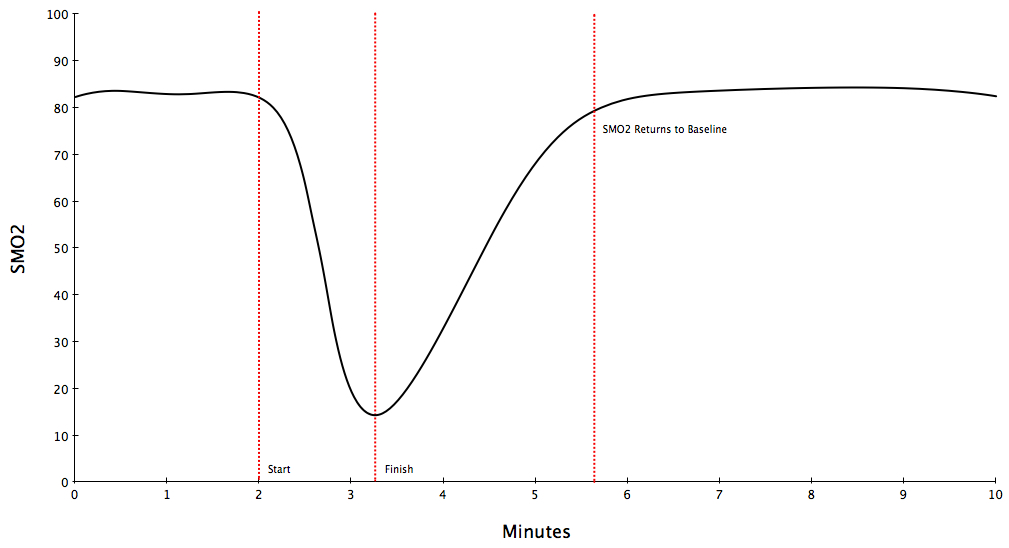
 Supply-Respiratory Weakness. The last graph shows a slower recovery response than the last three. In this case, muscle oxygen bottoms out just like the Supply Weakness, but the recovery is much slower– instead of 30-40 seconds, it takes more on the order of 1-2 minutes before muscle oxygen returns to baseline values. As the cardiac and venous system is fairly efficient in getting oxygenated system back to the muscles during recovery, this weakness suggests that the lungs simply can’t get enough oxygen converted into oxygenated blood quickly enough. This could be due to specific conditions (e.g. asthma), insufficient tidal volume, or low respiration rate.
So once you have identified your limiter, how do you address them. Well, I’m going out on a limb here, but for most endurance athletes, I’d say it probably comes down to one or two focused workouts a week as follows.
- Utilization Weakness. To bolster your mitochondria and oxygen uptake, you should focus on really intense intervals. This means stuff like maxVO2 intervals, hill intervals, and lactate intervals. Really hard efforts with a good long recovery– exactly the kind of workouts that most of us don’t normally do. Also, some Tabata intervals probably wouldn’t hurt, even though that stresses the supply side with its short recoveries.
- Supply Weakness. Here the goal is heart, lungs, and supply systems. So that means long endurance work to improve oxygen delivery systems. Again, Tabatas would work here but they will also put a bit of stress on the utilization side.
- Supply-Respiration Weakness. Here, specific lung training is probably in order. This means using a SpiroTiger or a PowerBreathe K4 or K5 device to strengthen the lungs. In another webinar on the Moxy site, Clint Friesen describes his work with Red Bull Project Endurance and provides specific recommendations on using the SpiroTiger for specific kinds of respiratory weaknesses.
As I mentioned above, I suspect that most well-trained endurance athletes will reveal a Utilization Weakness. In fact, in Clint Friesen’s webinar, he discusses a Tour de France athlete who had this issue– but was able to perform almost identically at 10,000 feet as he was at sea level because his heart and lungs outpaced his muscles to such a great degree. While it is awesome to have oxygen delivery systems that are this finely-tuned, it does leave a lot of speed on the table. As we’ll all be training those delivery systems with long workouts in the (glorious) summertime, now is a perfect time to work on that speed and give our heart and lungs a little bit of room to grow into.
 most of my training is endurance-focused, I decided to be a guinea pig for testing my hypothesis that I would have a utilization weakness. To test the theory, I went down to the track and ran 6 all-out 400 meter repeats on a generous 4 minutes recovery (basically, walked a lap). The results? A pretty clear utilization weakness! In fact, when I was running all-out, my muscle oxygen barely dipped 10% below its baseline value of about 80%.
A Guide to Warming Up
This application of a muscle oxygen monitor is a no-brainer and is the easiest justification for using one. Why do we warm up? Obviously, the answer is to warm up the muscles, dilate the blood vessels, and get oxygenated blood flowing into the muscles. Using a muscle oxygen monitor shows you exactly that– and gives you clear metrics around it.
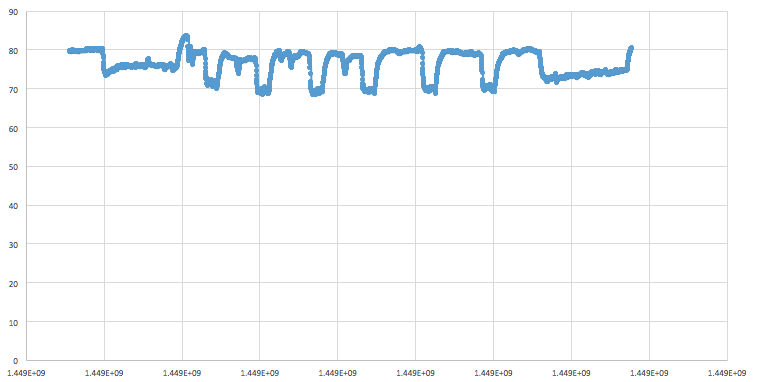
 When you use a muscle oxygen monitor, you may be surprised how low your muscle oxygen is when you first start it up. My values are typically only around 65-70%. As I warm up, these numbers slowly climb. If I throw in a few hard, short efforts during my warmup, the numbers climb even higher– ultimately topping out around 85% muscle oxygenation.
Getting those number high is exactly the goal of warming up. As you experiment with it, you’ll find that different strategies work better than others. For instance, I find that a steady 10-15 minutes zone 2 effort with a few intense bursts is just about perfect– much more effective than a slowly climbing zone 2-3 warmup. The picture at the right is a perfect example. In this screenshot from the BSX Insight iPhone app, my muscle oxygen is the blue line. For the first ten minutes, I was warming up. I threw in a few short 200 meter hard efforts– and each time, my muscle oxygen momentarily sank but then jumped up much higher. A little more jogging and I would repeat this until my muscle oxygen was around the mid-80’s– a that point, I knew I was primed and ready to go.
Of course, every person is different. Muscle oxygen levels vary based on muscle and skin type. You don’t need to establish perfect scores– just oxygen values that are near your high values.
Setting Workout Zones
A funny thing happens when you do a simple ramp test using a muscle oxygen monitor. If you haven’t warmed up, muscle oxygen shoots up almost immediately. If you started at a very slow walk and were well warmed up at the start, you’ll hit a momentary plateau but your values will quickly drop a few points as soon as you start jogging. Here is where things get interesting because, as you increase speed, your muscle oxygen levels pretty much stay pegged at that same value. As you increase speed, your heart rate and breathing will increase, but your muscle oxygen stays constant. All throughout this time, oxygen supply and utilization are in perfect balance– this is your aerobic training zone. Eventually, as you keep increasing speed, your muscle oxygen levels will fall and they may or may not hit a much smaller plateau. Then, you keep increasing speed, muscle oxygen will drop precipitously. Right before that point, you’ve gone past your lactate threshold and are venturing towards your maxVO2– you obviously won’t last long there.
This pattern reveals a lot about how to train. In fact, one easy way to set training zones using a muscle oxygen meter is to do a ramp test on a treadmill (preferably set at 1% grade to make up for the lack of air resistance) where you hold 3 minutes at a gentle walk (3 minutes is enough time for muscle oxygen to fully stabilize at a given pace), then increase the pace by 0.5-1.0 mph and hold for another 3 minutes. Keep repeating this pattern and you will soon be jogging, then running faster and faster. Eventually, you’ll have to quit because you can’t hold the pace any longer.
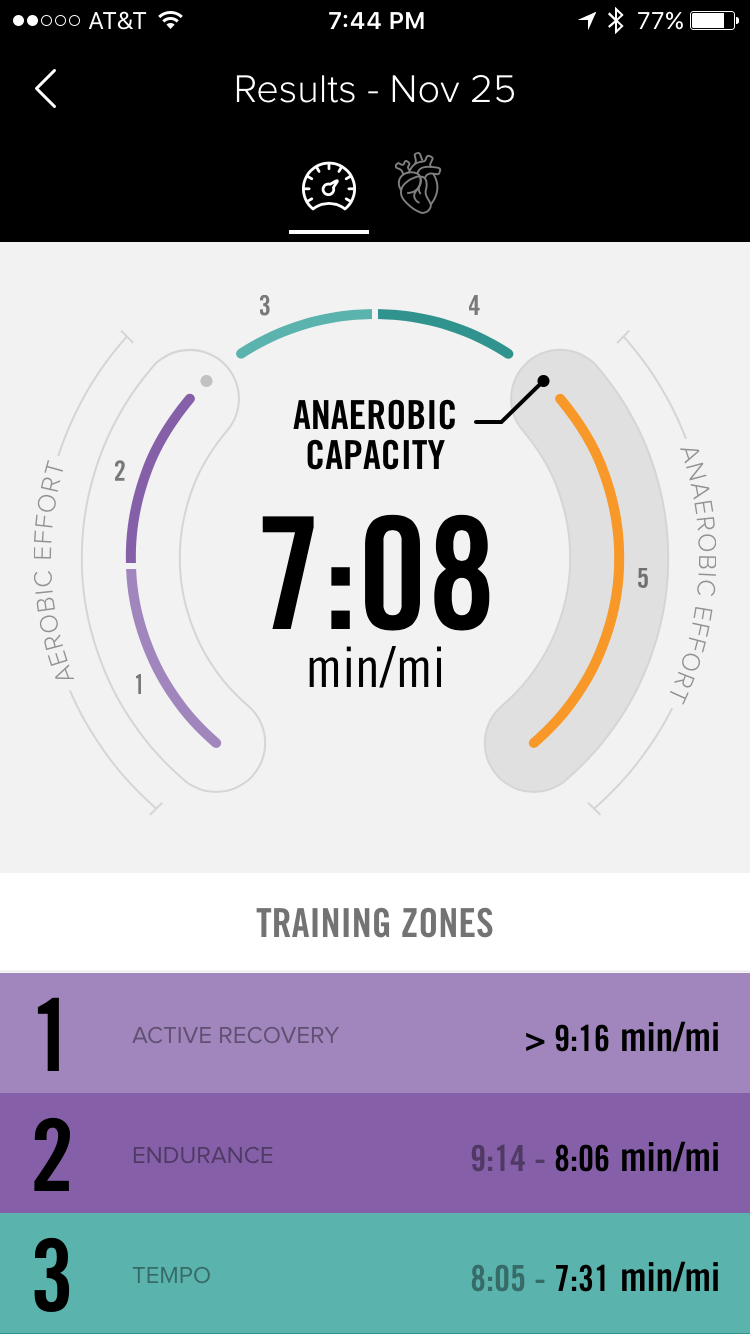
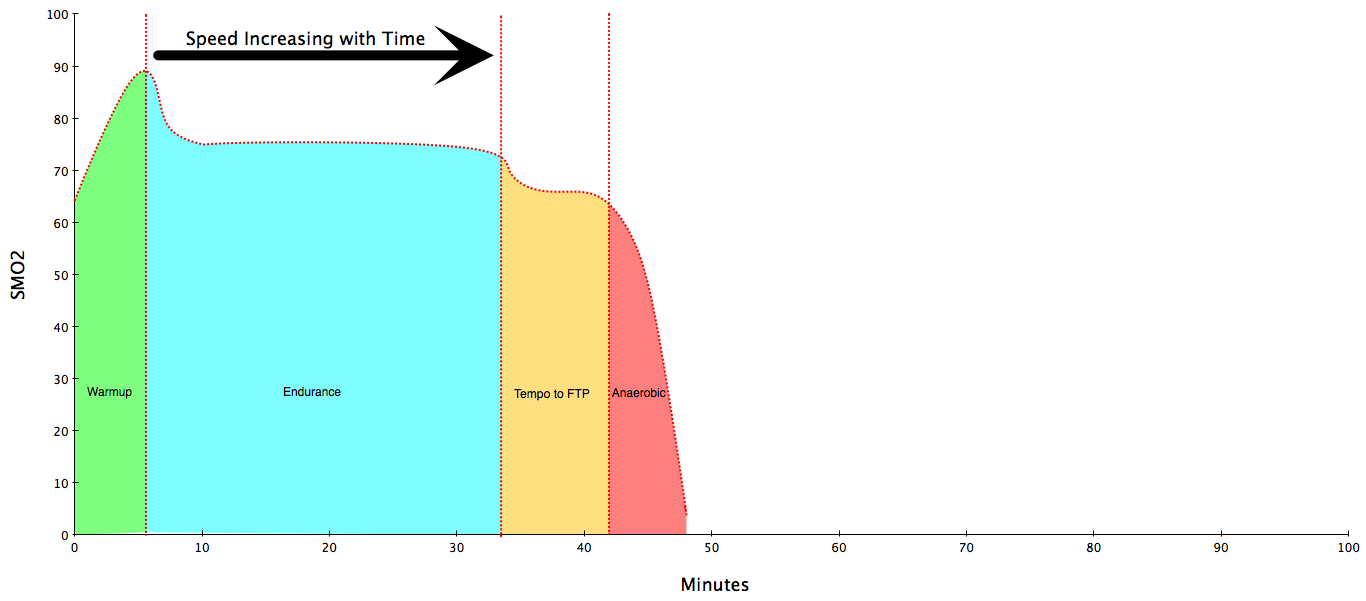 In the textbook example, you will have a curve like the one on the right. It shows a rapid spike in muscle oxygen from your resting state to a high point. This is your recovery zone (shown in green)– where your body gets the most oxygen possible to the muscles. As pace increases, we get a long plateau (shown in light blue). In this zone, your body is in homeostasis– oxygen supply is meeting demand and oxygen levels are quite good. This is your endurance zone. As you go faster, there is a drop in muscle oxygen and another plateau (shown in orange). This is your tempo to FTP zone– this is “comfortably hard” effort to race pace. Above that, muscle oxygen starts to tank (shown in red). This is your anaerobic zone. Here, the wheels are falling off the truck.
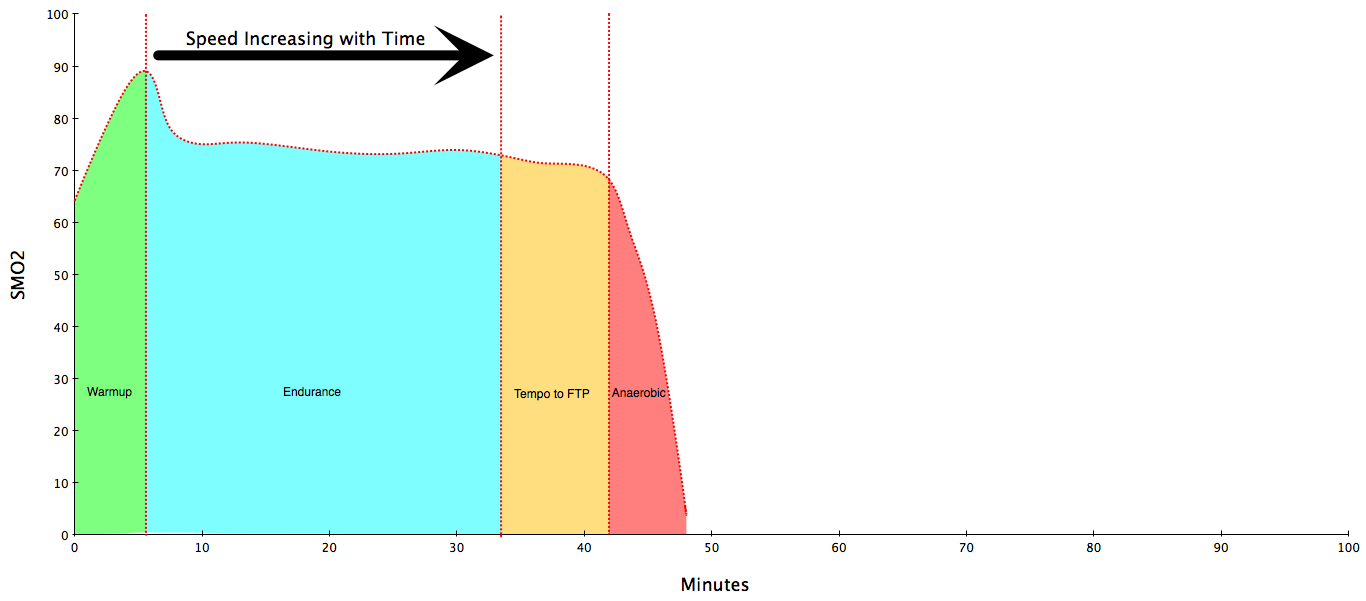 Often, however, that second plateau either doesn’t show up or is barely discernible. This is shown in the chart on the right. Here, it’s still easy to see where the recovery and anaerobic zones are– but it’s much harder to draw a clear line between the endurance zone and the tempo to FTP zone. I personally think that this reflects a lack of time spent at the upper edges of FTP and that more racing will bring that second plateau into clearer view– but again that’s just my personal conjecture.
A Guide to Optimizing Workout Intensity and Duration
If you’re trying to really nail your FTP intervals, one way to do that is to workout at the very right edge of the orange (tempo to FTP) zone because this is the highest point at which your body is at homeostasis. Because your body’s abilities fluctuate day-to-day (based on stress, sleep, recovery, nutrition, etc), it’s often futile to just rely entirely on numbers (such as a specific number of watts). Fortunately, muscle oxygenation can give a much better insight into whether a load is north or south of the FTP redline.
How? Easy. Just watch what happens during an interval. Saying your are riding 5 minute intervals. If you see muscle oxygen staying at a nice plateau, you know you are at or below redline. So if you hit your first 5 minute interval and your muscle oxygen is fading throughout the interval and you’re feeling pretty weak, it’s probably too much of a load– back it off 10 watts and try again. On the other hand, if muscle oxygen is flat as a pancake during your interval and you’re feeling strong, add a few watts on the next interval.
And this isn’t just for a single interval. While your muscle oxygen will likely decrease a tiny amount between sets, if you see it start to really fall between sets, you know that you’re at your limit. It’s time to pack it up and stop those interval sets. This last trick (comparing muscle oxygen responses between interval sets) also works on shorter anaerobic intervals as well. In those shorter intervals, you’re intentionally going into the red anaerobic zone so your muscle oxygen is tanking on each interval. Between sets, muscle oxygen recovers but if you see that the lowest values on each interval really starts to nosedive after a number of sets, it’s probably time to call it a day.
If you’re interested in this aspect of using muscle oxygen in your training (with some real world examples), check out Richard Wharton’s blog for Cycling Center Dallas.
A Guide to Optimizing Recovery
Normally, muscle oxygen spikes back to baseline values really quickly. Remember that one of the key advantages of using muscle oxygen instead of relying on heart rate is that muscle oxygen has relatively little lag compared to heart rate. But if you are really taxing your system with hard intervals and short recoveries, you may be shortchanging yourself because you can’t expect to work out with the same intensity in a hypoxic state.
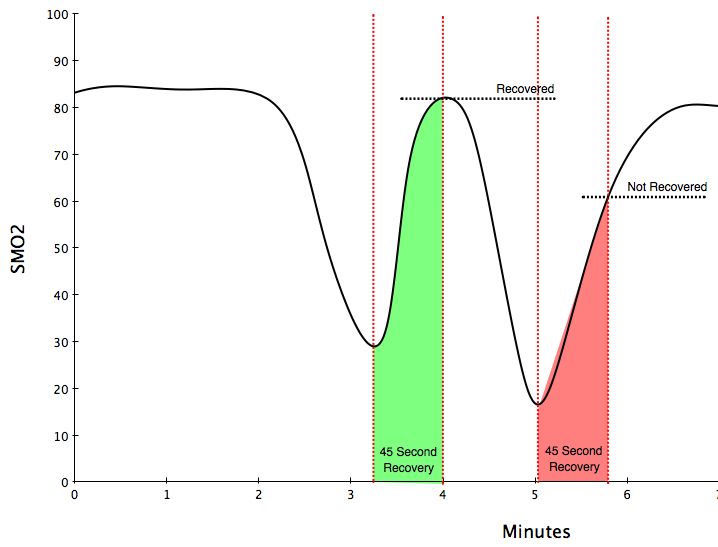 So one way to double-check if you are properly recovered from your interval workout is to check your muscle oxygen at the end of your prescribed recovery period. For instance, consider the graph at the right. Here, an athlete is performing a series of hard 1-minute intervals on 45-second recoveries. After the first interval, the athlete could check her muscle oxygen at the end of 45 seconds and she would notice that her muscle oxygen was up near her baseline values after she finished warming up. Even though she still feels a quite tired, she hits her second interval hard. This time, she checks her muscles oxygenation and notices that it is far below her baseline values. In this case, 45 seconds is not nearly long enough– if she hopes to perform anywhere close to her last performance, she should wait until her muscle oxygenation returns to close to her original values.
Again, however, muscle oxygen normally responds quite quickly. I suspect that relying on muscle oxygen alone for determining recovery would be a hellish interval workout full of ridiculously short recoveries– but I could very well be wrong. Until someone proves me wrong, I think muscle oxygen should be best used as a double-check to see if your current recovery protocol is adequate.
Nailing Down Your Lactate Threshold
 If you have a BSX Insight monitor, using muscle oxygen to calculate your lactate threshold is super easy. Well, “super easy” to calculate– not so super-easy to actually do as it involves a good amount of exercise suffering. You put on the monitor and fire up the app on your Android phone or your iPhone. It then walks you through a series of three minute steps, starting from “very easy” and slowly progressing to “impossibly hard.” By the end, you’re running a 3 minute step that is so fast that you can’t continue. As I’m in the middle of my down season, my values weren’t spectacular– I couldn’t hold 3:00 at a 6:00 per mile pace. Once you call it quits, the app uploads your data and, after a few seconds of silicon-based cogitating, it comes back with your lactate threshold– along with a series of zone recommendations. I’ve done a couple of these tests and they seem relatively consistent.
I’ve also been thinking about how the human body reaches homeostasis (steady state) in terms of muscle oxygen. It makes sense then that where that homeostasis breaks down and muscle oxygen takes a nosedive would coincide pretty well well the maximum level at which the human body could sustain working out for a reasonably long period. 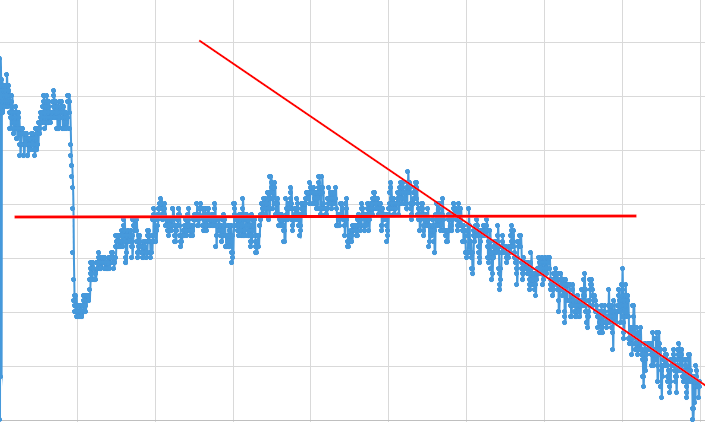
On the right is a screenshot of the raw data that created my lactate threshold results. If you look at the graph, there is a pretty clear breakpoint after which my muscle oxygen takes a steep dive downwards. Well, when I drew a set of lines through my data and calculated where in my ramp-up that breakpoint occurred, it coincided pretty closely with the lactate threshold that my BSX had predicted. I’m sure that BSX’s algorithms are quite a bit more sophisticated than my rough eye-balling. But even this simple exercise identifies the maximal point at which your body is at homeostasis– above it (to the right) and muscle oxygen starts to crash while below it (to the left) muscle oxygen is easily sustainable.
Summary
There is a lot to like about using a muscle oxygen sensor. Going back to the reasons for using one, here are my thoughts about the value of using a muscle oxygen sensor.
- Rapid Identification of Limiters to Performance. Not as useful for most endurance athletes because I think we ALL have utilization weaknesses. The special case is athletes who suspect that they have a Supply-Respiratory weakness (e.g. asthma, breathing muscle weakness, etc). If you fall into this category, then a muscle oxygen monitor can verify whether specific breathing training would be useful.
- Effective Warm-Ups. The clearest reason to use one is to tell you are warmed up and ready. We all know what it’s like to blow a workout or a race when we’ve thought that we’re not properly warmed up. And I can just about guarantee that most people don’t warm up enough. Using a muscle oxygen meter tells you when you are (finally) ready to go.
- Setting Workout Zones. Less useful for me. It’s much easier to just rely on power zones from an FTP test. Muscle oxygen might be useful near the end values of each range, however, to see if you’re pushing too hard or goofing off.
- Optimizing Workout Intensity and Duration. This is really valuable, but I think it’s much easier if you are using PerfPro Studio and seeing graphical realtime data like Richard Wharton does at the Dallas Cycling Center.
- Optimizing Recovery During Interval Training. To me, this is the second most important reason to wear a muscle oxygen sensor– a good double-check to see if you’re recovered enough to run your next interval.
- Nailing Down Your Lactate Threshold. This is the third most important reason to using a muscle oxygen sensor because it sets good training zone values for you. Alternatively, you could just rely on a recent race time but this does it a little more accurately. If you’re not racing at least once a month, then get a BSX Insight to test your values.
Getting a Muscle Oxygen Sensor
I can’t promise you that a muscle oxygen sensor is going to change your life or get you onto the podium. What I can promise you is that it will give you another useful data point. How to make that data point truly useful for you is what this article is all about– but this intended as a list of options as opposed to a definitive guide. Because everyone is different, some ideas may work in your training and others won’t work at all.
With that disclaimer, the two muscle oxygen sensors on the market today are the Moxy and the BSX Insight. The Moxy costs a little less than $800 and is available directly from their site. You can get the BSX Insight from a number of sources, but most easily from the BSX site directly. Earlier I described how you can get one for 10% off should you choose to order one directly. It costs between $300 and $420, depending on which model you get (as you’re multisport athletes, you’ll probably want the more expensive unit to get lactate threshold tests for both cycling and running).
Thanks for reading and be sure to like the Athletic Time Machine Facebook page and follow us on Twitter @AthTimeMachine. If you found this post useful, please reblog it on WordPress, share it on Facebook, or retweet it on Twitter to share it with your friends.

[…] https://athletictimemachine.com/2015/12/20/an-idiots-guide-to-using-a-muscle-oxygen-sensor/ […]
LikeLike
Hi, nice write up. I am just a recreational cyclist but have been using both Moxy and BSX for quite a while out of interest in biometric technologies as a professional human factors researcher and luckily both companies have been open to many interesting discussions. Though the details seem much more complicated and a lot is still hypothetical, overall I’d agree with your summary … but then again some of our information sources do overlap so we might be biased in the same way. 😉
One possible caveat, that you mentioned briefly: although the scale of SmO2 values of Moxy and BSX seem to agree for some users, for some users including me they are far off, to the point that if I’d apply that simple diagnosis to, say, very hard 2 minutes intervals I did last week, I’d have a supply limitation according to the Moxy but an utilization limitation according to the BSX. Not saying that either of these is right or wrong, but from my experience using both on my body, my conclusion is that they don’t “measure” the same “thing”.
Another thought: my understanding is that, even if I just look at cycling, the “limiter” is not a single fact but will depend on the exercise I do, and the ability to identify the limiter for specific types of load is what makes SmO2 so valuable. And in that respect, for me, the more responsive scale of the Moxy is currently more “useful” to me, and having my 3 Moxy sensors placed on either each VL and deltoid (for independent measuring of delivery) or VL, calf and deltoid is very revealing, whereas one BSX on one calf kinda always hints at a utilization limitation which I yet find difficult to apply to my training.
LikeLiked by 2 people
Thanks for the comment! I agree with everything that you mentioned. While I don’t own a Moxy, from what I’ve read, the “scale” seems to me to be much more exaggerated on a Moxy than a BSX. I’m actually a bit suspicious of the objectivity of the Moxy in that regard. While I’m certainly not an exercise physiologist, it seems odd that a person could exercise so intensely that muscle oxygenation could approach 5-10% as sometimes happens with online SMO2 graphs that I’ve seen from Moxy users. I would think that some other limiter in the body would prevent that from happening because such low values seems awfully dangerous to muscle cell viability. But maybe true objectivity isn’t what is needed if the goal is just to identify trends and weaknesses?
Yes, limiters do vary depending on what exercise you do. But also within a single exercise, different limiters should apply. For instance, while further research and experience with SMO2 is needed, I think it’s a mistake to assume that a track sprint cyclist should have the same SMO2 curves as a grand tour cyclist. My suspicion is that a Tour de France cyclist will almost always tend to show utilization weaknesses compared to the track cyclist and the track cyclist will tend to show supply limitation compared to the Tour de France cyclist. In that case, they are both equally fit– just tuned to a different discipline. I bet that, five to ten years from now, we’ll have different curves specific to endurance athletes and sprinters.
Interesting stuff about the different muscle groups. I’ve heard that the vastus lateralis almost always shows the most exaggerated SMO2 curves, particularly with cycling. Is that your experience? Because of that, I do think it would be nice if BSX or Moxy made shorts with a sensor holder.
LikeLiked by 2 people